File:Disability Adjusted Life Year Weight Plot.v2.svg
From WikiMD's WELLNESSPEDIA

Size of this PNG preview of this SVG file: 768 × 591 pixels. Other resolutions: 312 × 240 pixels | 624 × 480 pixels | 998 × 768 pixels | 1,280 × 985 pixels | 2,560 × 1,970 pixels.
Original file (SVG file, nominally 768 × 591 pixels, file size: 71 KB)
Summary
| Description |
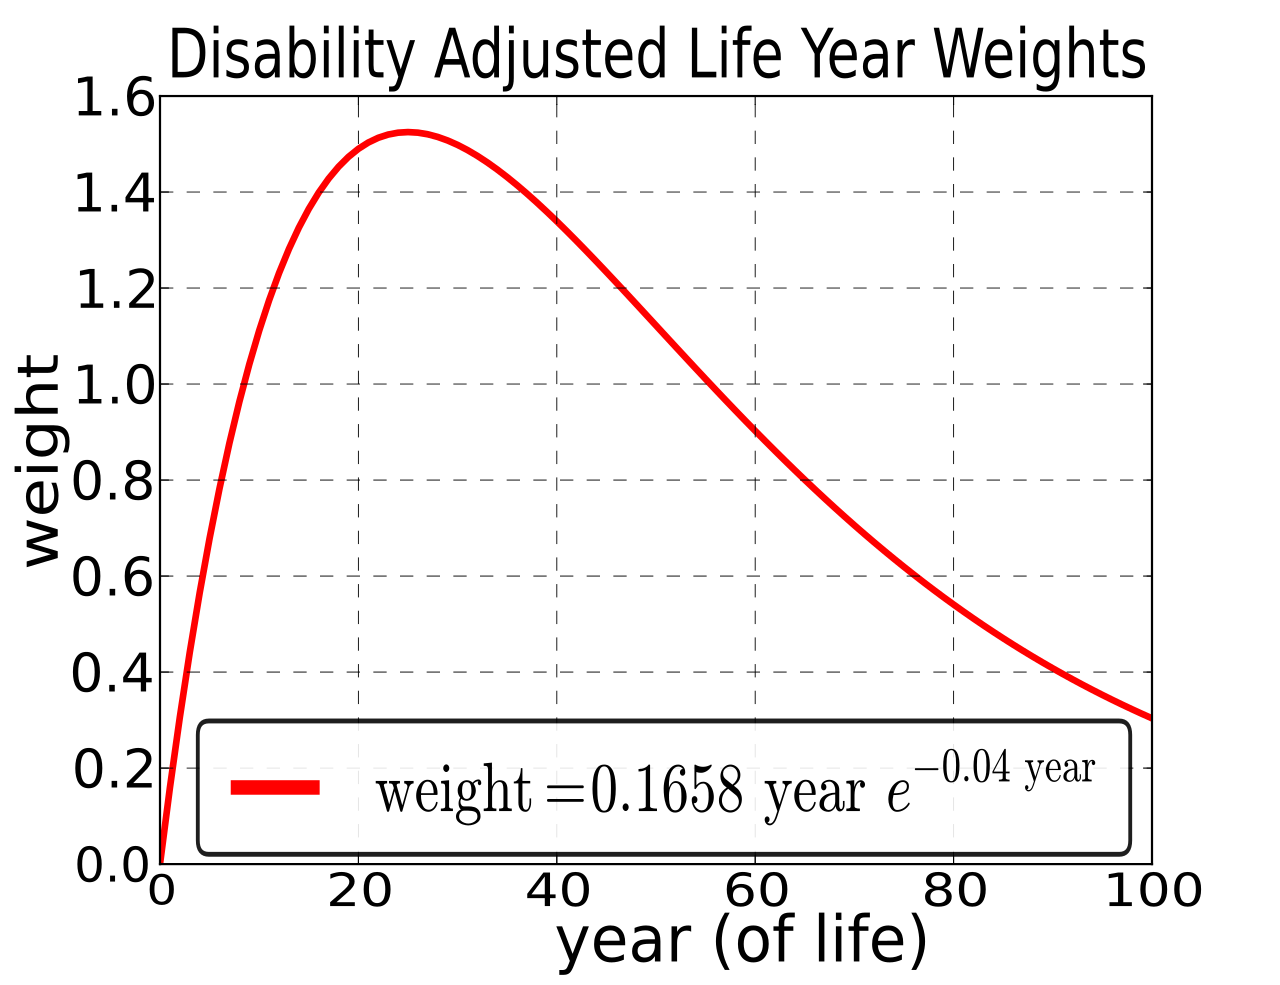
English: Plot of the arbitrary formula used to discount years of life for the young and old in policy decisions. Year of life against weights using the reationship y = 0.1658 year e^(-0.04 year). Svg made with matplotlib for python. - Some studies use DALYs calculated to place greater value on a year lived as a young adult. This formula produces average values around age 10 and age 55, a peak around age 25, and lowest values among very young children and very old people. Comparable to Figure 3.1 in this WHO report [1]. |
| Date | |
| Source | Own work |
| Author | RememberOrwell |
| SVG development |  This vector image was created with an unknown SVG tool. This vector image was created with an unknown SVG tool. |

Licensing
RememberOrwell, the copyright holder of this work, hereby publishes it under the following license:

|
This work has been released into the public domain by its author, RememberOrwell. This applies worldwide. In some countries this may not be legally possible; if so: RememberOrwell grants anyone the right to use this work for any purpose, without any conditions, unless such conditions are required by law. |
derivative work by File:Disability_Adjusted_Life_Year_Weight_Plot.svg
File history
Click on a date/time to view the file as it appeared at that time.
| Date/Time | Thumbnail | Dimensions | User | Comment | |
|---|---|---|---|---|---|
| current | 23:27, 24 May 2024 | | 768 × 591 (71 KB) | wikimediacommons>RememberOrwell | Enlarged font for readability at small sizes typical on-wiki |
File usage
The following page uses this file: