File:Cardiac and vascular function curves.png
From WikiMD's WELLNESSPEDIA
No higher resolution available.
Cardiac_and_vascular_function_curves.png (632 × 461 pixels, file size: 13 KB, MIME type: image/png)
Summary[edit]
| Summary | |
|---|---|
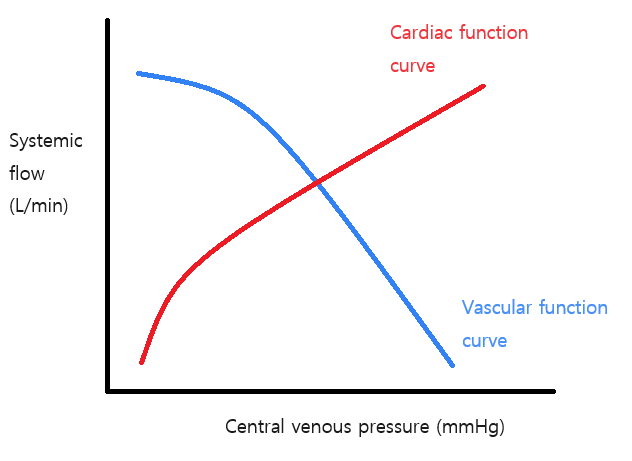
| Description | The cardiac function curve expresses how systemic flow changes as a function of the central venous pressure; it represents the Frank-Starling mechanism. The vascular function curve expresses how "central venous pressure" changes as a function of "systemic flow". Note that, for cardiac function curve, "central venous pressure" is the independent variable and "systemic flow" is the dependent variable; for vascular function curve, the opposite is true. |
| Source | Wikimedia Commons file page |
| Author | Dollasdal |
| Permission | See original Commons license details. |
Licensing[edit]
Creative Commons Attribution 4.0 International (CC BY 4.0)
This file is licensed under the Creative Commons Attribution 4.0 International license.
You may share and adapt the material provided appropriate attribution is given.
Official license: CC BY 4.0
License page: CC BY 4.0
Original attribution and file history: Wikimedia Commons
File history
Click on a date/time to view the file as it appeared at that time.
| Date/Time | Thumbnail | Dimensions | User | Comment | |
|---|---|---|---|---|---|
| current | 03:26, 5 June 2026 | | 632 × 461 (13 KB) | Maintenance script (talk | contribs) | == Summary == Importing file |
You cannot overwrite this file.
File usage
The following 2 pages use this file:
