File:Fatchart.svg

Original file (SVG file, nominally 511 × 446 pixels, file size: 43 KB)
Summary[edit]
| Summary | |
|---|---|
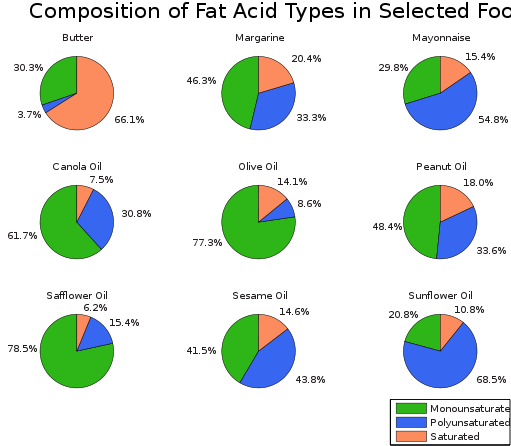
| Description | Relative amounts of types of fat acids in selected foods.
The composition of fat by fat acid type of various foods is shown. The data have been taken from Gebhardt, Susan E.; Robin G. Thomas (2002). "Nutritive Value of Foods" (PDF). Home and Garden Bulletin. Archived from the original on 2009-03-20. Retrieved on 2006-07-27., which is a publication of the United States Department of Agriculture. Pie charts were made in MATLAB. |
| Source | Wikimedia Commons file page |
| Author | Xyzzy n at English Wikipedia |
| Permission | See original Commons license details. |
Licensing[edit]
Creative Commons Attribution-ShareAlike 3.0 Unported (CC BY-SA 3.0)
This file is licensed under the Creative Commons Attribution-ShareAlike 3.0 license.
Official license: CC BY-SA 3.0
License page: CC BY-SA 3.0
Original attribution and file history: Wikimedia Commons
File history
Click on a date/time to view the file as it appeared at that time.
| Date/Time | Thumbnail | Dimensions | User | Comment | |
|---|---|---|---|---|---|
| current | 13:38, 8 June 2026 | | 511 × 446 (43 KB) | Maintenance script (talk | contribs) | == Summary == Importing file |
You cannot overwrite this file.
File usage
The following page uses this file:
