File:Greenhouse Effect (2017 NASA data).svg
From WikiMD's WELLNESSPEDIA

Size of this PNG preview of this SVG file: 600 × 600 pixels. Other resolution: 2,048 × 2,048 pixels.
Original file (SVG file, nominally 960 × 960 pixels, file size: 7 KB)
Summary[edit]
| Summary | |
|---|---|
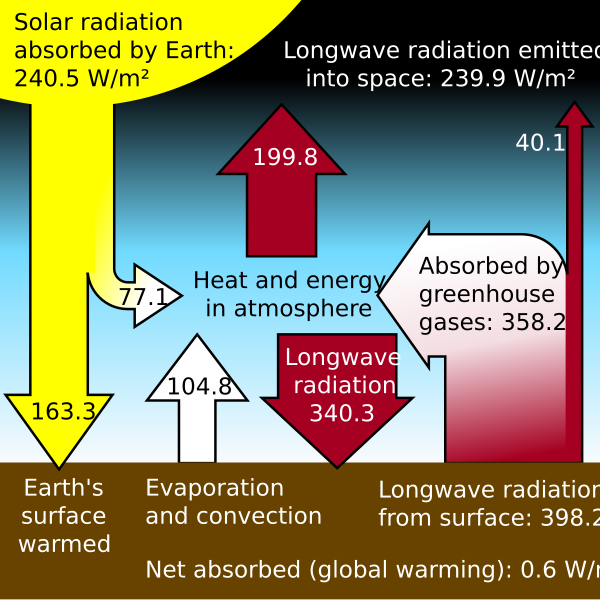
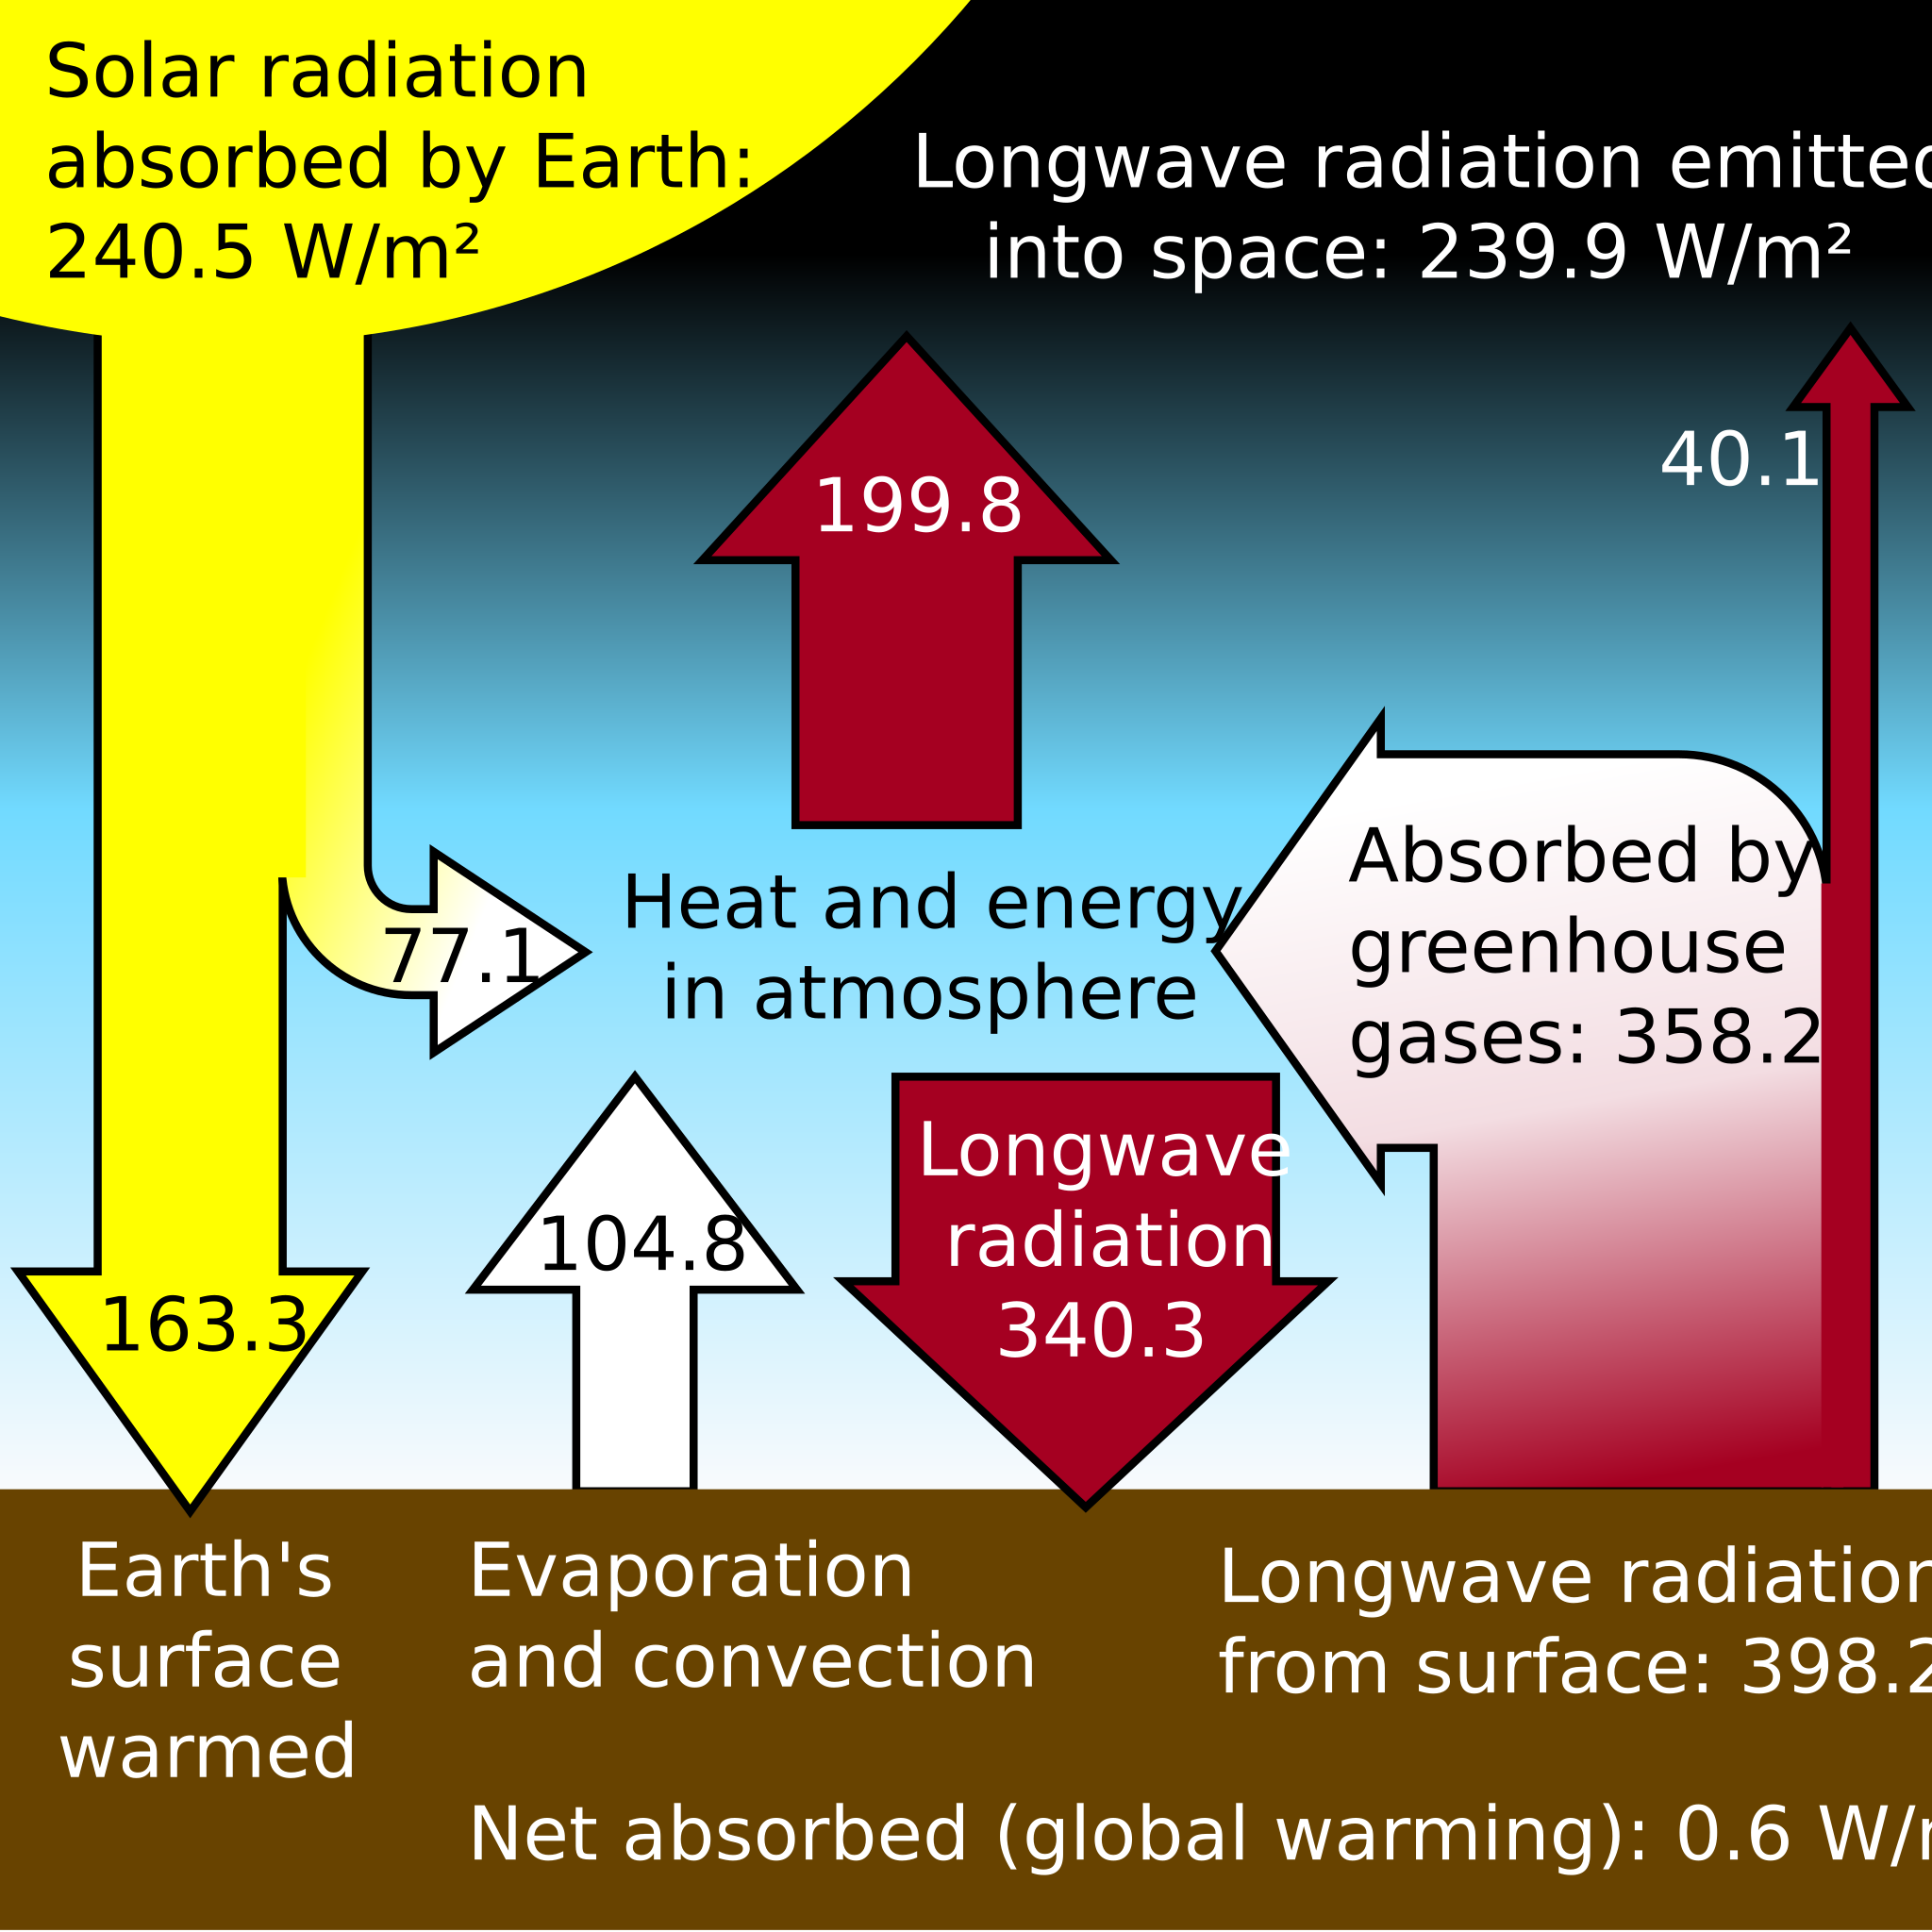
| Description | This figure is a simplified, schematic representation of the flows of energy between space, the atmosphere, and the Earth's surface, and shows how these flows combine to trap heat near the surface and create the greenhouse effect. Energy exchanges are expressed in watts per square meter (W/m2).
Data is from 2007 CERES satellite instruments, and specifically this diagram Year 2021 update (not in diagram): Net absorbed energy (shown as 0.6) rose to above 1.0 W/m2 based on independent CERES and ocean heat content measurements.(see fig.1 in Loeb et al.(2021), Geoph. Res. Let 48 (13), doi:10.1029/2021GL093047) |
| Source | Wikimedia Commons file page |
| Author | Robert A. Rohde (Dragons flight at English Wikipedia) |
| Permission | See original Commons license details. |
Licensing[edit]
GNU Free Documentation License (GFDL)
This file is licensed under the GNU Free Documentation License.
You may copy, distribute, and modify the work under the terms of the GNU Free Documentation License.
Official license: GNU FDL 1.3
License page: GFDL 1.2
Original attribution and file history: Wikimedia Commons
File history
Click on a date/time to view the file as it appeared at that time.
| Date/Time | Thumbnail | Dimensions | User | Comment | |
|---|---|---|---|---|---|
| current | 22:26, 8 June 2026 | | 960 × 960 (7 KB) | Maintenance script (talk | contribs) | == Summary == Importing file |
You cannot overwrite this file.
File usage
The following page uses this file:

.svg&action=edit§ion=1)
.svg)
.svg&action=edit§ion=2)
.svg&oldid=6609038)