File:P300 vs local oddball probability.svg
From WikiMD's WELLNESSPEDIA

Size of this PNG preview of this SVG file: 800 × 374 pixels. Other resolution: 2,560 × 1,196 pixels.
Original file (SVG file, nominally 1,053 × 492 pixels, file size: 424 KB)
Summary[edit]
| Summary | |
|---|---|
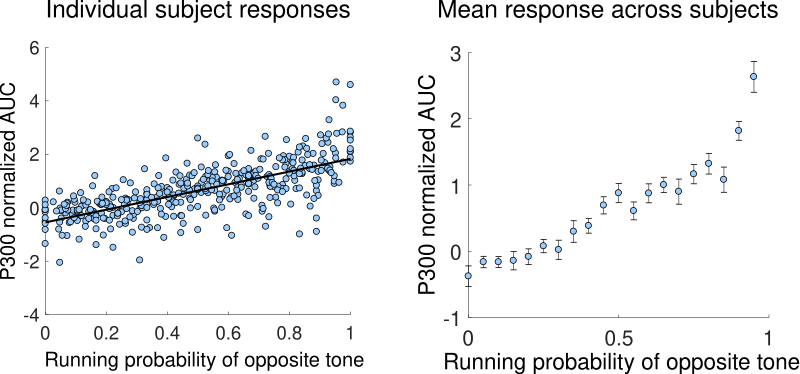
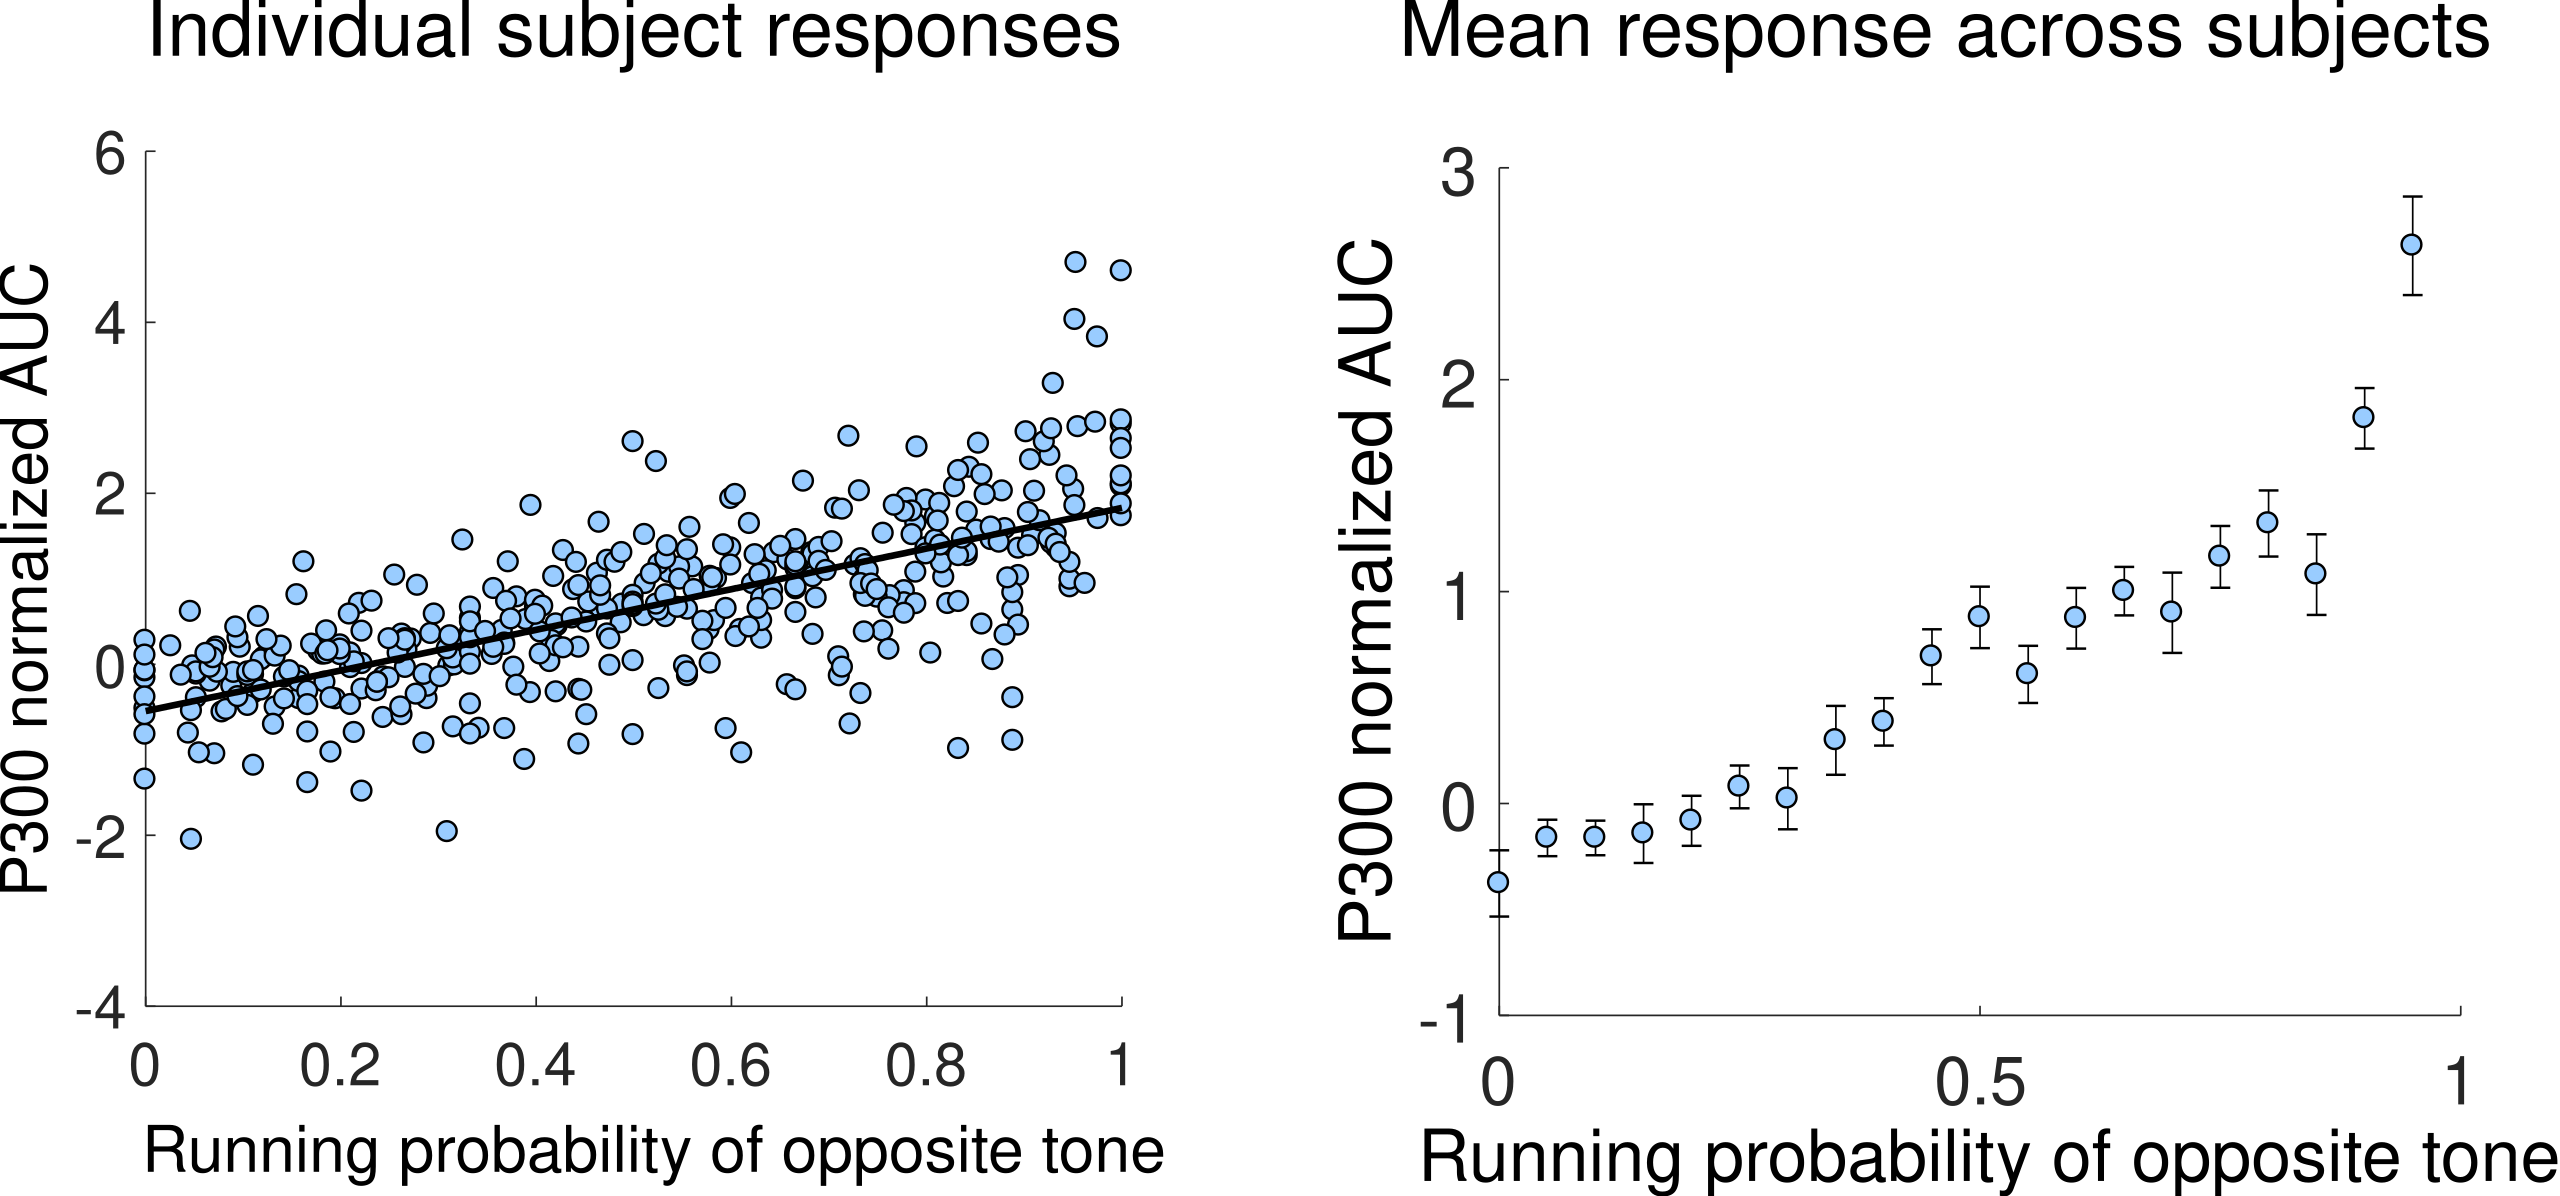
| Description | Left: The mean normalized P300 area-under-the-curve (AUC) of each subject is plotted as a function of the running probability (RP) of the opposite tone. The RP on each trial is defined as p=n/N, where n is the number of occurrences of the opposite tone (with respect to the current tone) in the preceding N tones in the sequence (N is fitted individually for each subject). R^2=0.498, 409 data points, error DOF = 407, F-statistic vs. constant model: 404, p-value=7.28x10^-63. Right: The mean responses across all subjects as a function of the RP, calculated using the data presented on the left panel. The error bars indicate the SEM. |
| Source | Wikimedia Commons file page |
| Author | Hadarl |
| Permission | See original Commons license details. |
Licensing[edit]
Creative Commons Attribution-ShareAlike 4.0 International (CC BY-SA 4.0)
This file is licensed under the Creative Commons Attribution-ShareAlike 4.0 International license.
You are free to:
- Share — copy and redistribute the material.
- Adapt — remix, transform, and build upon the material.
Under the following conditions:
- Attribution — appropriate credit must be given.
- ShareAlike — derivative works must be distributed under the same license.
Official license: CC BY-SA 4.0
License page: CC BY-SA 4.0
Original attribution and file history: Wikimedia Commons
File history
Click on a date/time to view the file as it appeared at that time.
| Date/Time | Thumbnail | Dimensions | User | Comment | |
|---|---|---|---|---|---|
| current | 22:35, 8 June 2026 | | 1,053 × 492 (424 KB) | Maintenance script (talk | contribs) | == Summary == Importing file |
You cannot overwrite this file.
File usage
The following page uses this file:
