File:Radiocarbon bomb spike.svg

Original file (SVG file, nominally 600 × 480 pixels, file size: 27 KB)
Summary[edit]
| Summary | |
|---|---|
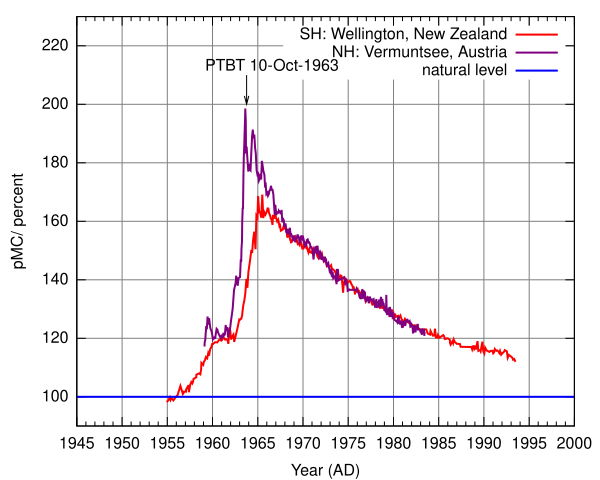
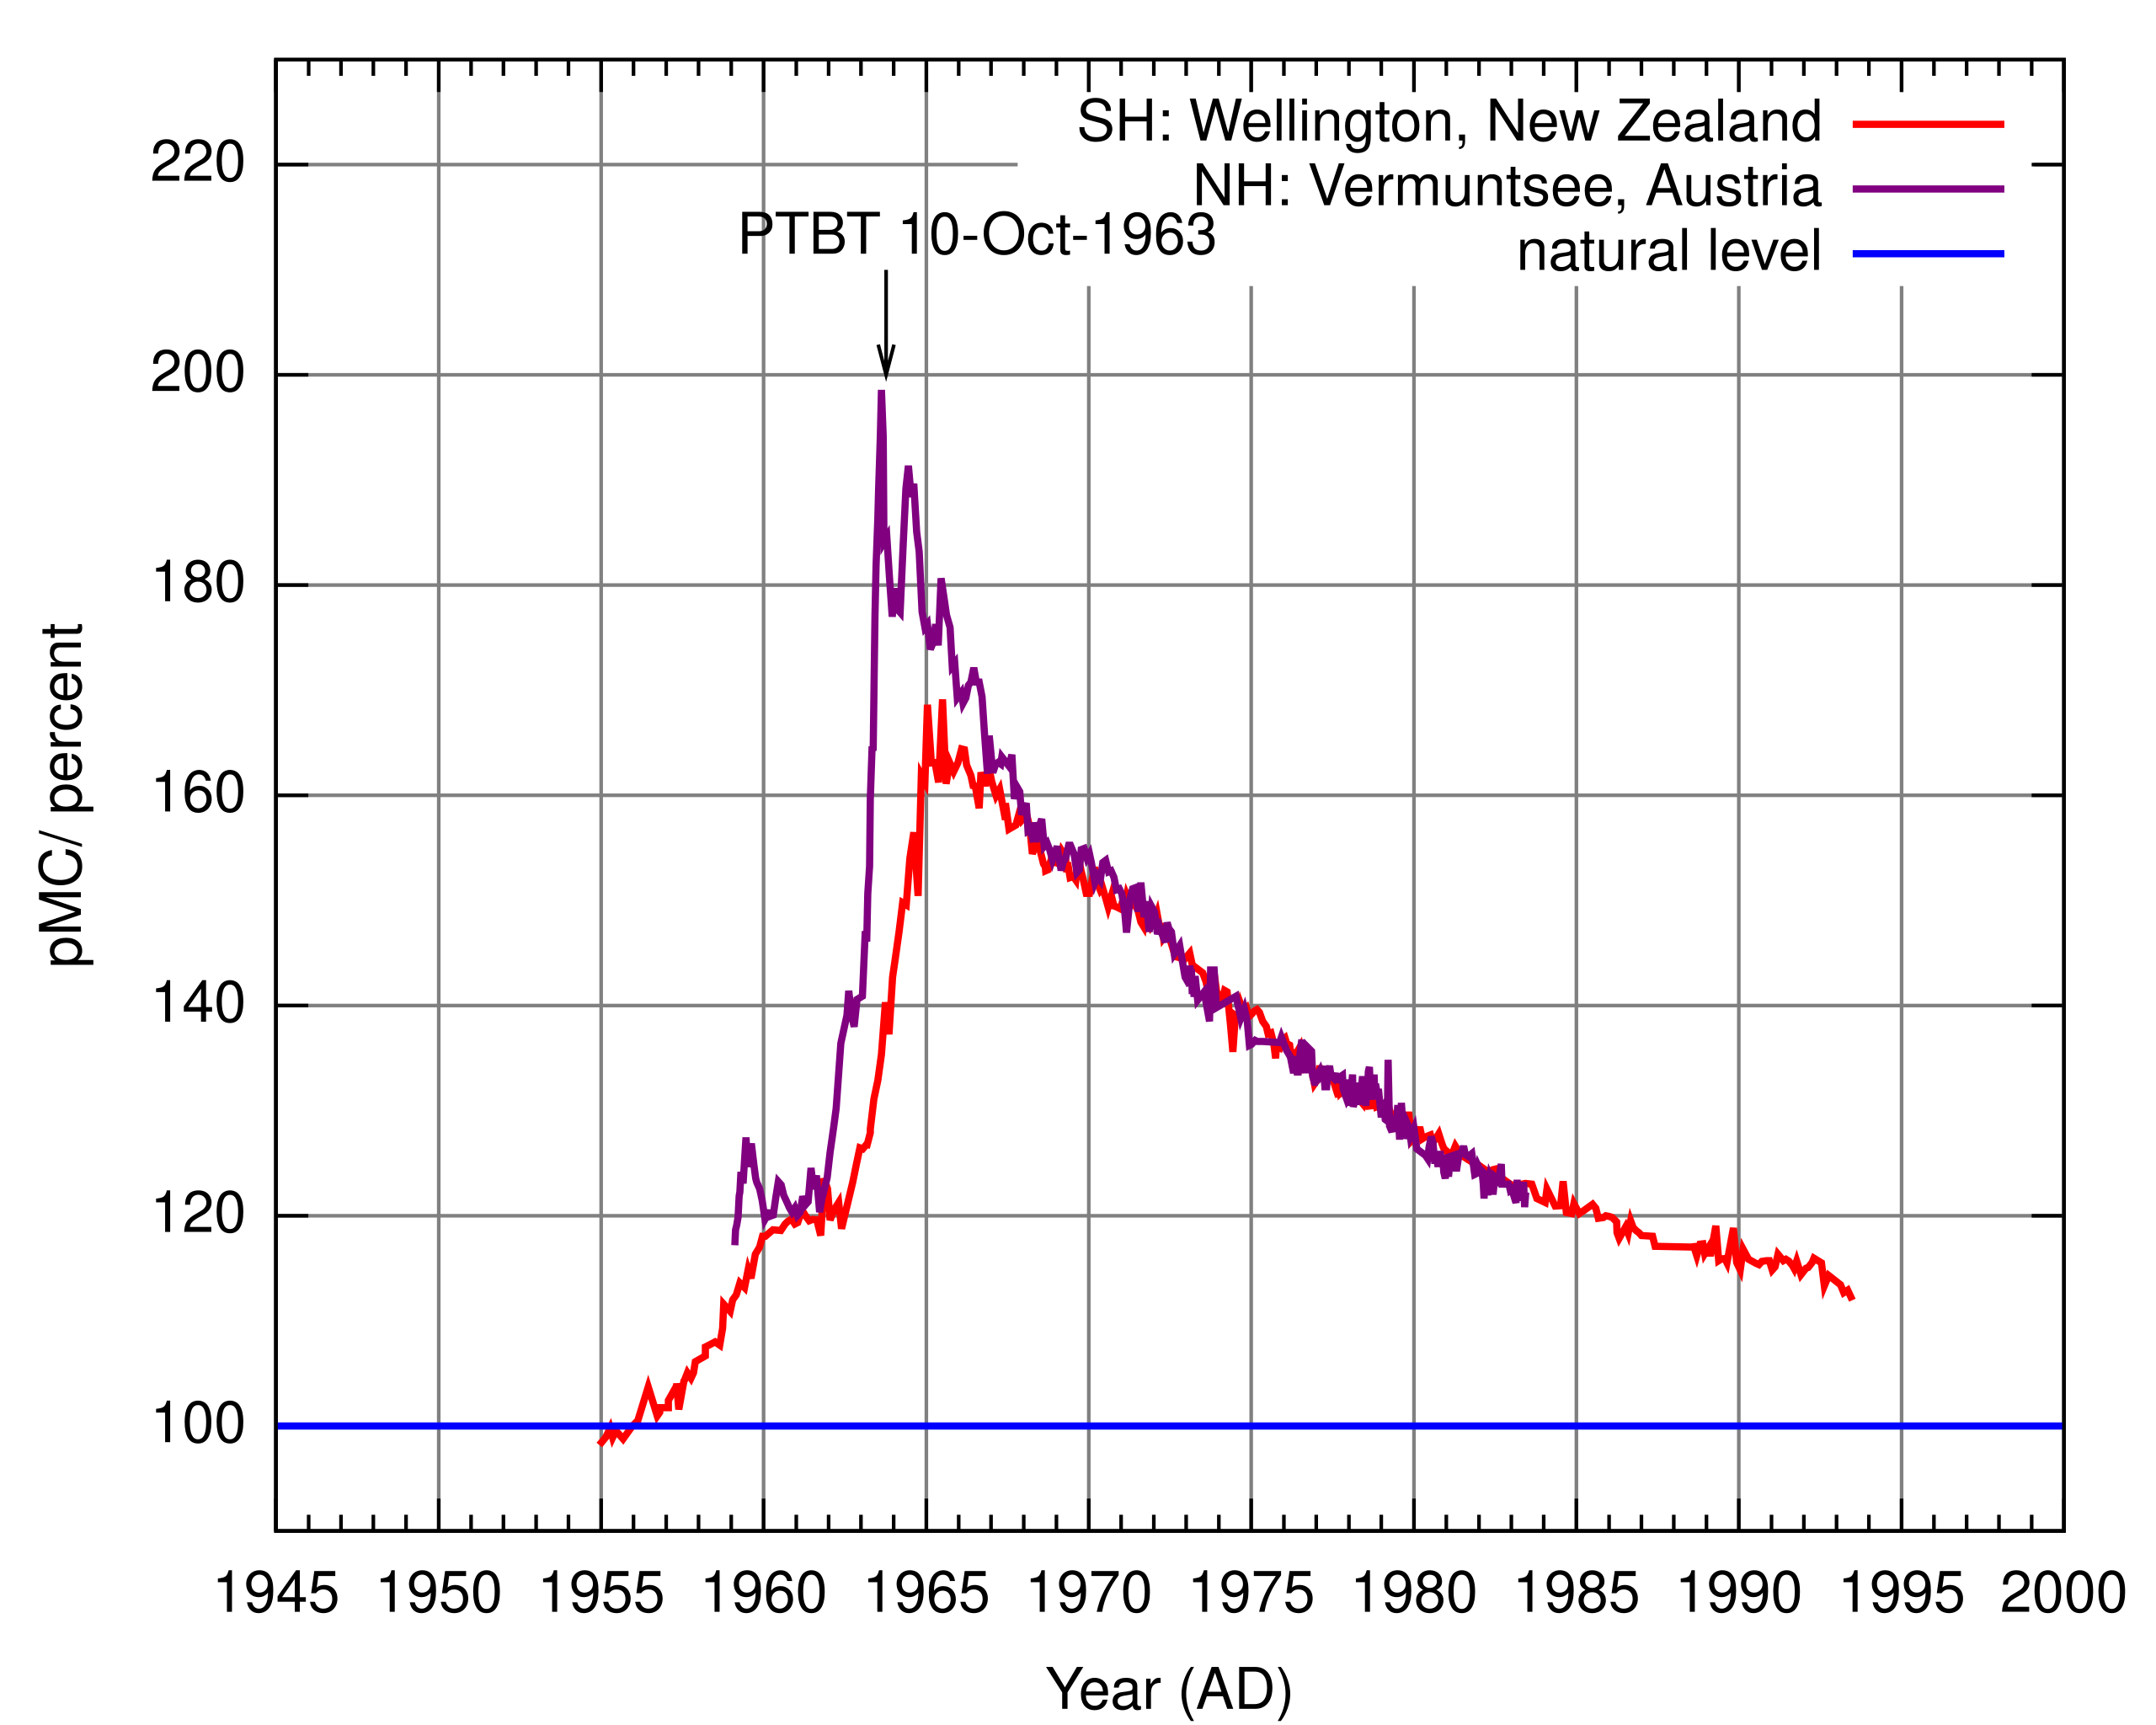
| Description | Atmospheric 14CO2 in the second half of the 20th century.
The figure shows the 14C / 12C ratio relative to the natural level in the atmospheric CO2 as a function of time in the second half of the 20th century. The plot was generated with gnuplot from data of atmospheric radiocarbon in Wellington, New Zealand 1954AD to 1993AD and at the Vermuntsee, Austria 1959AD to 1983AD. The SVG file from gnuplot has been improved manually. The data sources provide the data as D14C. For the plot the absolute percent modern value has been calculated assuming that each measurement was done in the same year as the respective sample was taken. |
| Source | Wikimedia Commons file page |
| Author | Hokanomono |
| Permission | See original Commons license details. |
Licensing[edit]
Public Domain
This file is in the public domain and may be used without restriction.
Please see the linked source page for the original file history, attribution information, and licensing details.
Original attribution and file history: Wikimedia Commons
File history
Click on a date/time to view the file as it appeared at that time.
| Date/Time | Thumbnail | Dimensions | User | Comment | |
|---|---|---|---|---|---|
| current | 12:51, 29 May 2026 | | 600 × 480 (27 KB) | Maintenance script (talk | contribs) | == Summary == Importing file |
You cannot overwrite this file.
File usage
The following 4 pages use this file:
